Long-Term Observations
David Moss, a climate scientist, takes daily measurements of atmospheric CO₂ at the Mauna Loa Observatory in Hawaii. The Keeling Curve, the longest continuous record of atmospheric CO₂ in existence, is a key reference point used worldwide to track the climate's status.
Community science volunteers write down the birds they see near a wetland during Audubon's Great Christmas Bird Count. The oldest continuous bird count provides information about the status and range of bird populations across the Americas.
These are both examples of long-term observations.
-
The climate crisis highlights the importance of long-term observations. It makes it more critical than ever to know if we are bending the carbon curve or not. The Keeling Curve, one of our long-term observation measures, helps us to understand whether our actions are making a difference.
Long-term observations are essential for monitoring the health of systems that support life on Earth, for identifying new phenomena that impact our climate and other systems, and for understanding the interactions of these phenomena. The more data we have that show past and current trends, the better we can predict and plan for the future – for us and for wildlife.
-
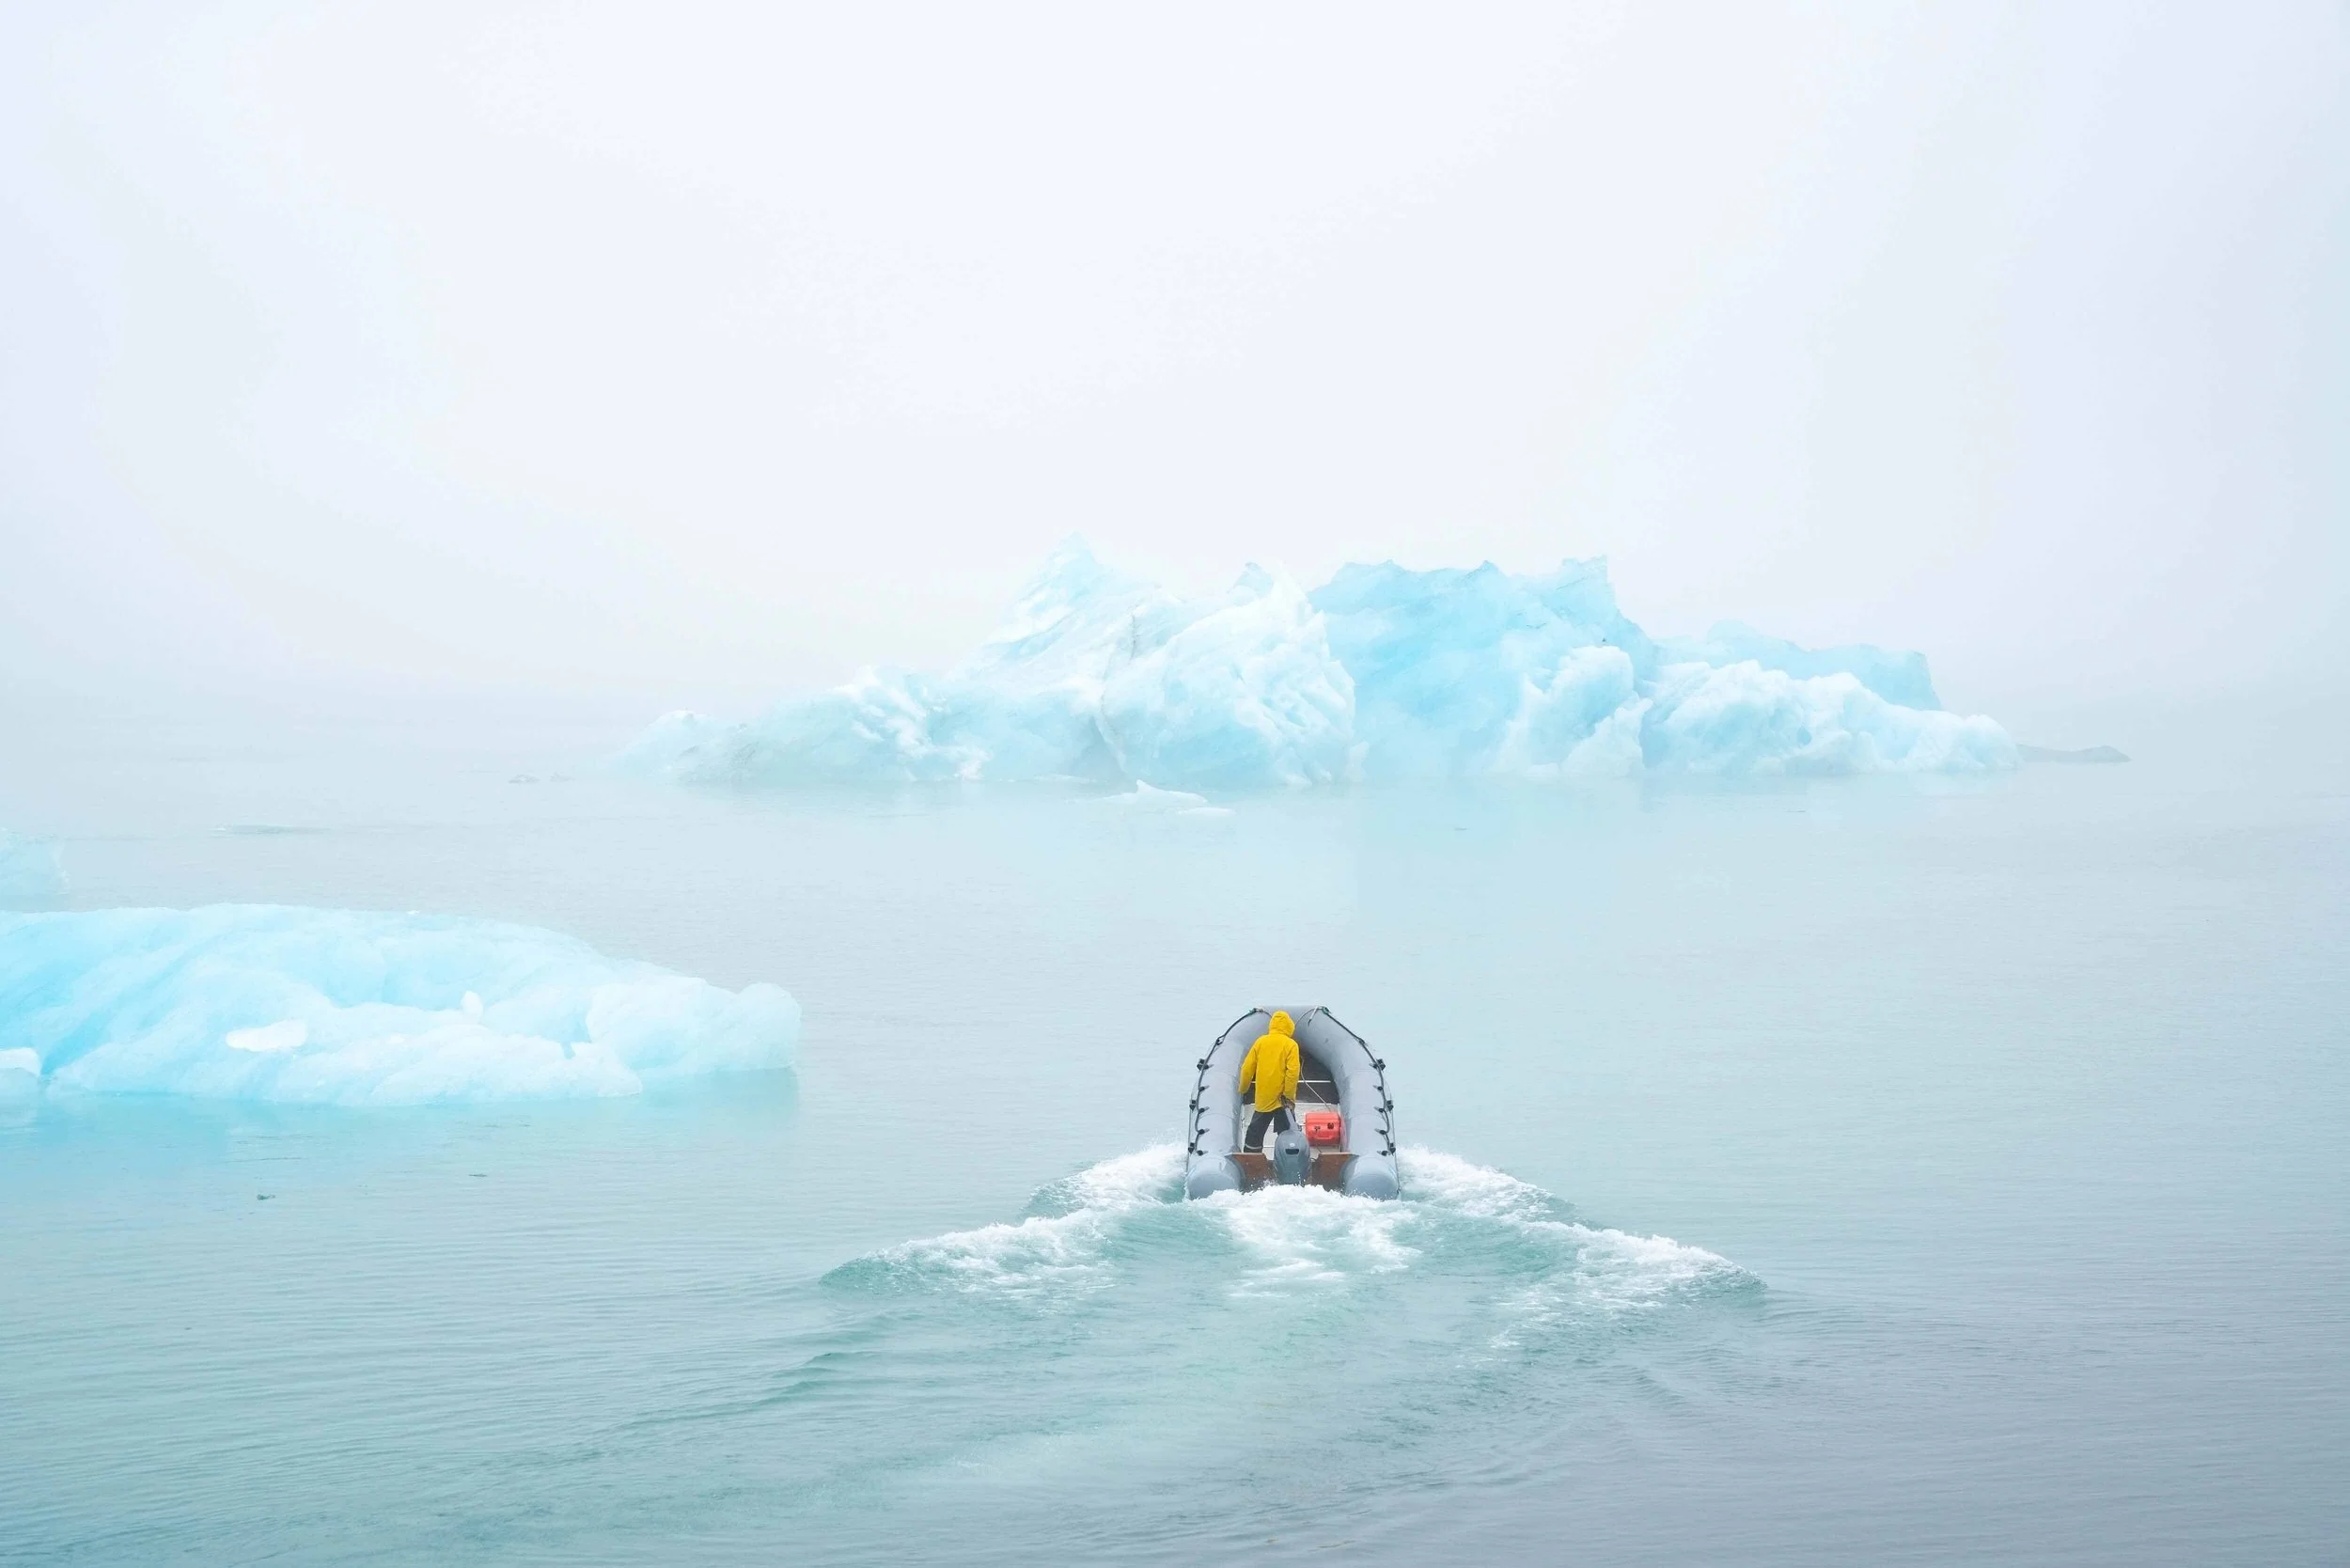
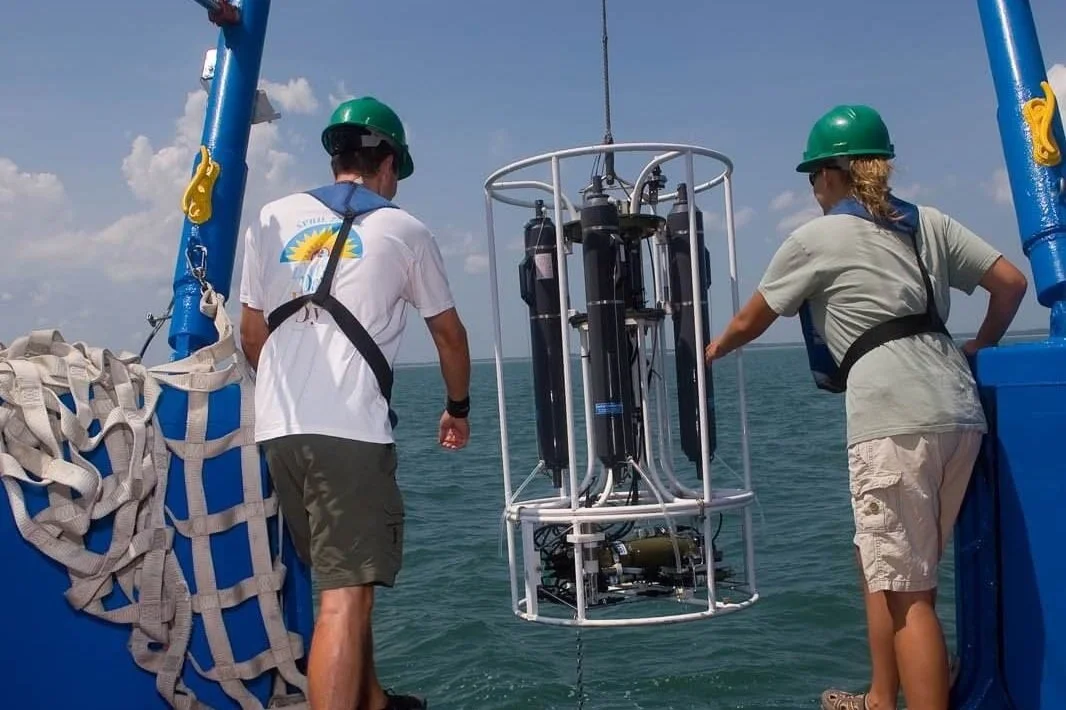
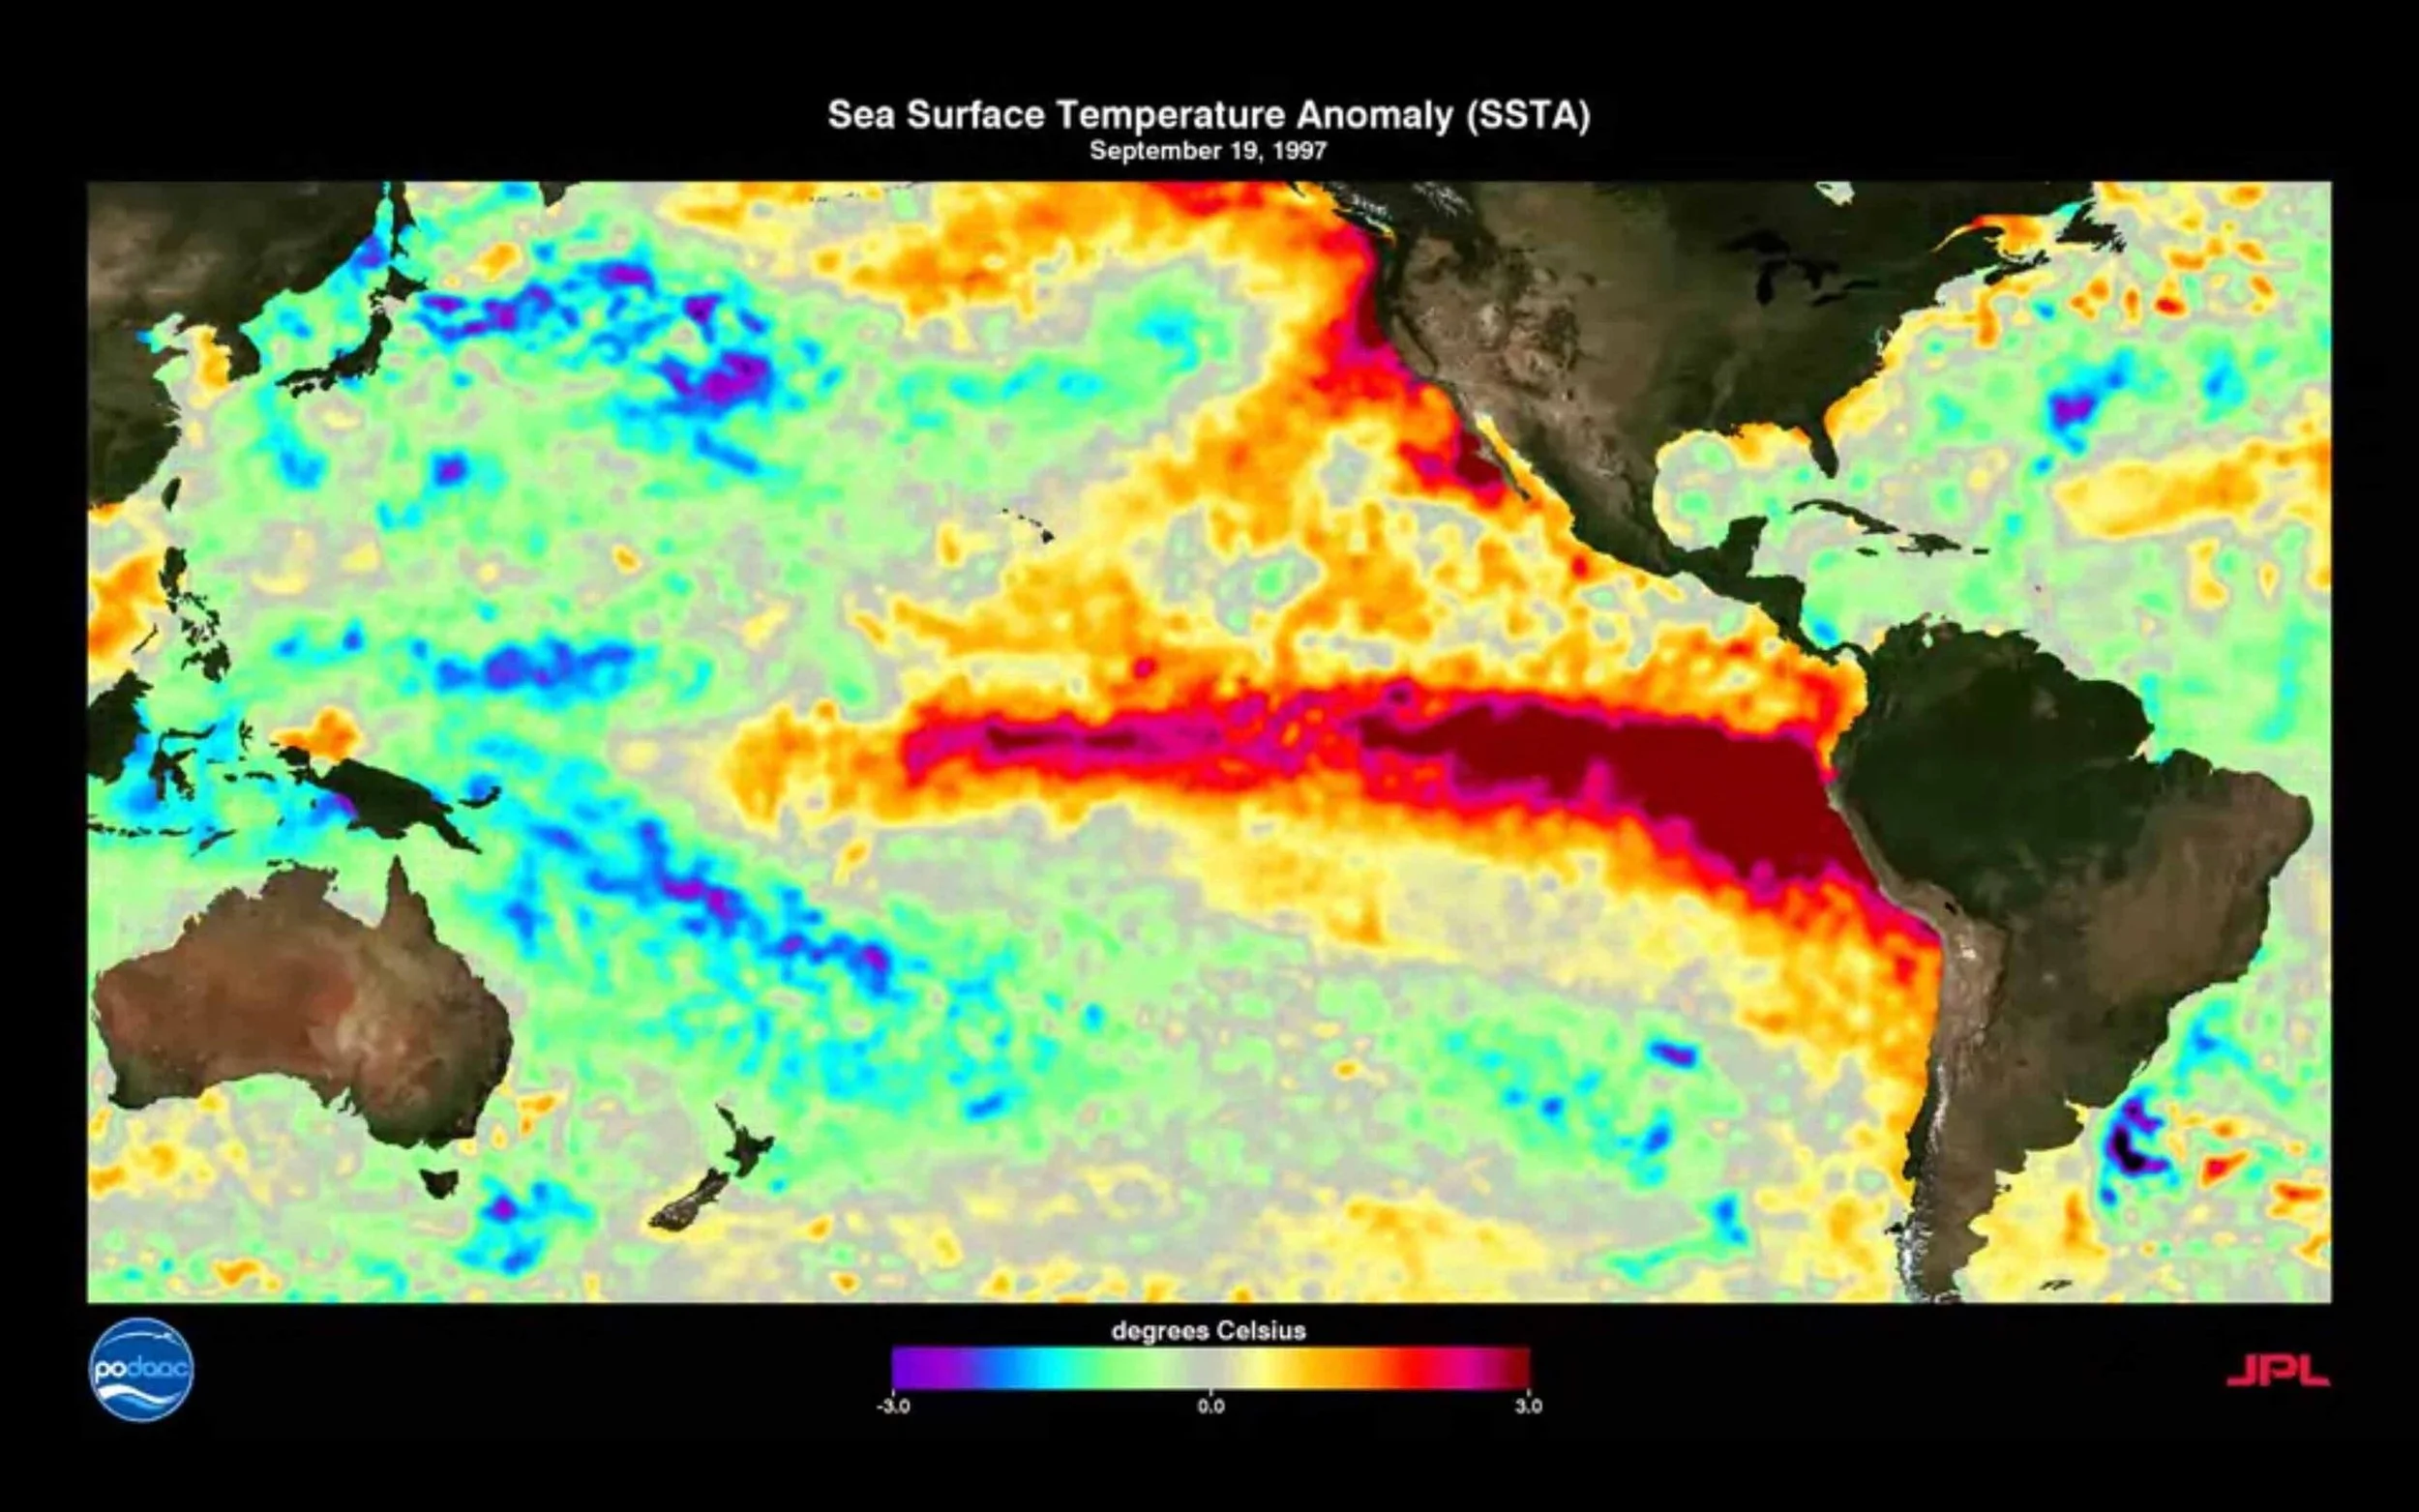
Long-term observations are quantitative observations, measurements, samples, or records of a subject taken at repeated intervals over a long period of time. The subject can be anything – the health of an ecosystem in a specific geographical area; a species of migratory bird; the chemical properties of a lake – that can be observed at repeated intervals. Repetition allows us to identify whether things are changing over time, how much they are changing, and whether they might continue to change. Some observations are conducted on-site (“in situ”). Others are taken remotely from a sensor or satellite. Some focus on a single location, while others take data from multiple sites.
The best and most informative long-term records include many precise, well-calibrated measurements taken at frequent intervals over a long period of time. But how long is long enough? That depends on the system we want to study. For example, some insect species have life cycles of days, so we can measure genetic changes in many generations of insects over the span of months. In contrast, changes in sea level happen much more slowly, rising several centimeters per decade. Additionally, many natural processes have cycles that are evident only if we measure at the right sampling frequency. For example, temperate plants photosynthesize only part of the year. If we sampled plant biomass – which increases in the spring and decreases in the fall – only once per year, we would not see the seasonal variation in plant matter, However, if we sample monthly, we get a much clearer picture.
-
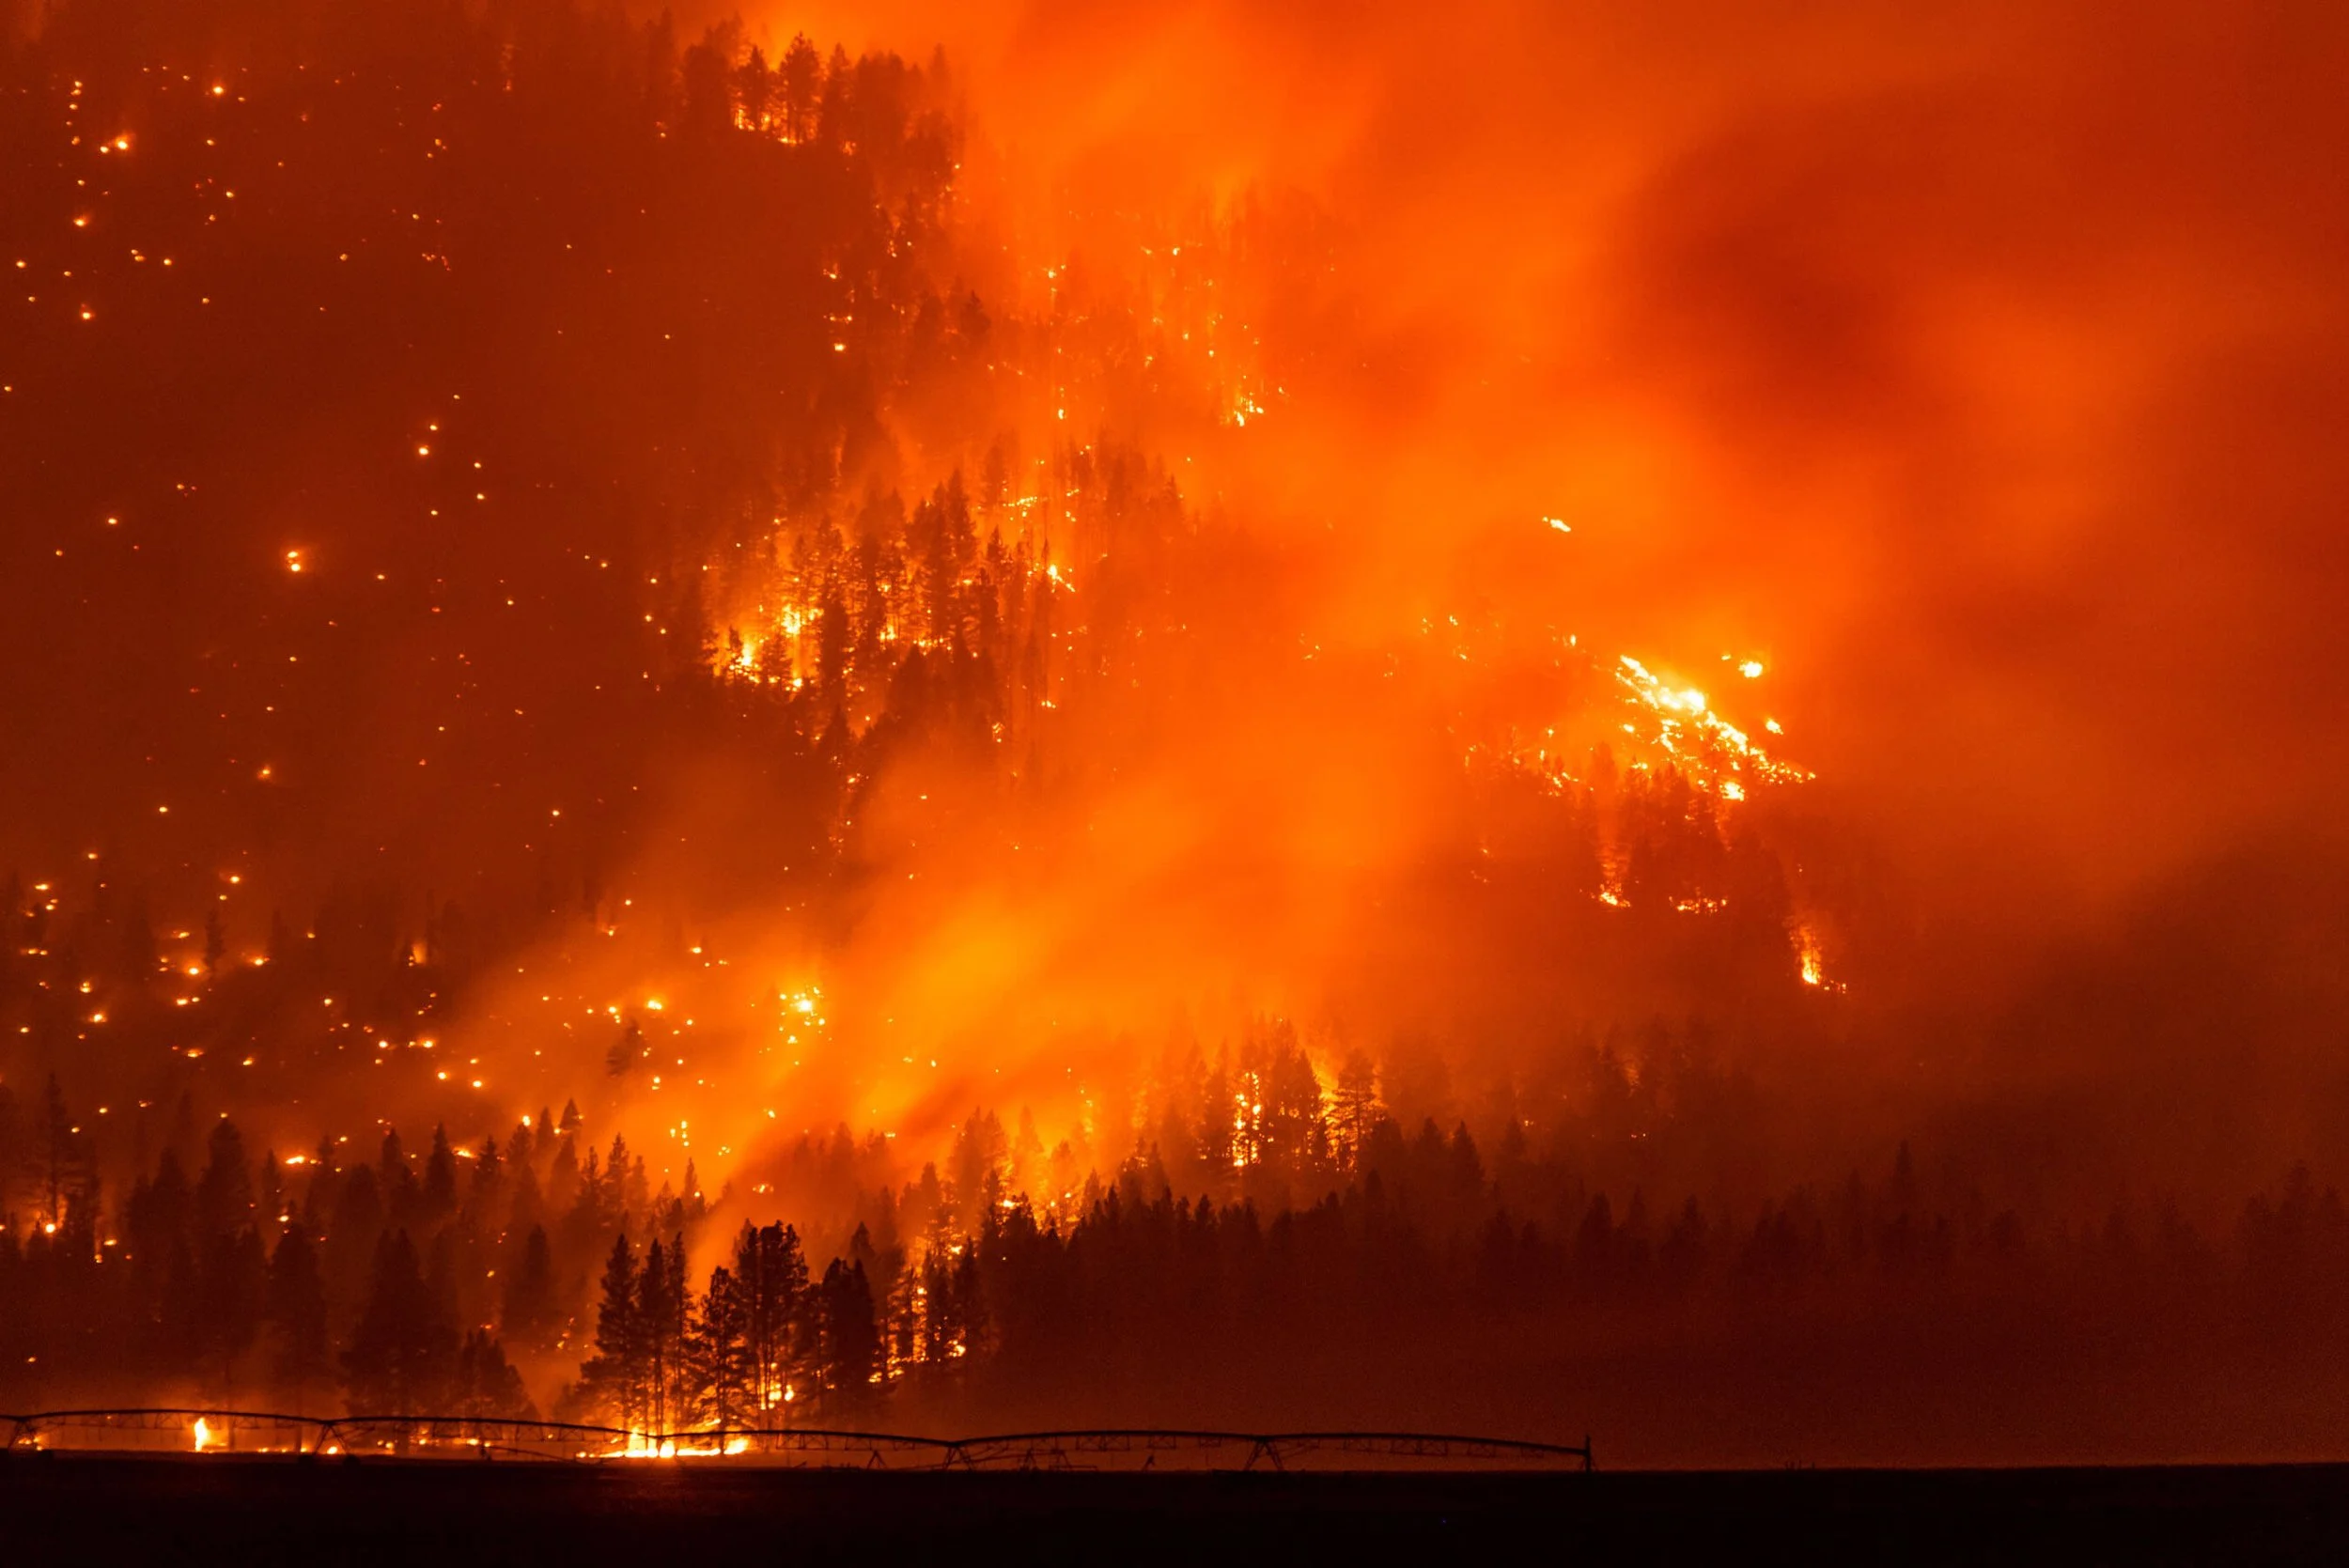
Critical long-term observations are at risk of being cut every year. The heroes of this story are individuals who are willing to carry out repetitive measurements in a funding climate that often characterizes long-term measurements as “routine monitoring” and favors research that can pay off within a few years. But just as there is nothing routine about tracking vital signs of a patient undergoing intensive care, there is also nothing routine about tracking environmental change during the ongoing planetary emergency.
“The only way to figure out what is happening to our planet is to measure it, and this means tracking changes decade after decade and poring over the records.”
— R Keeling, Science (2008)
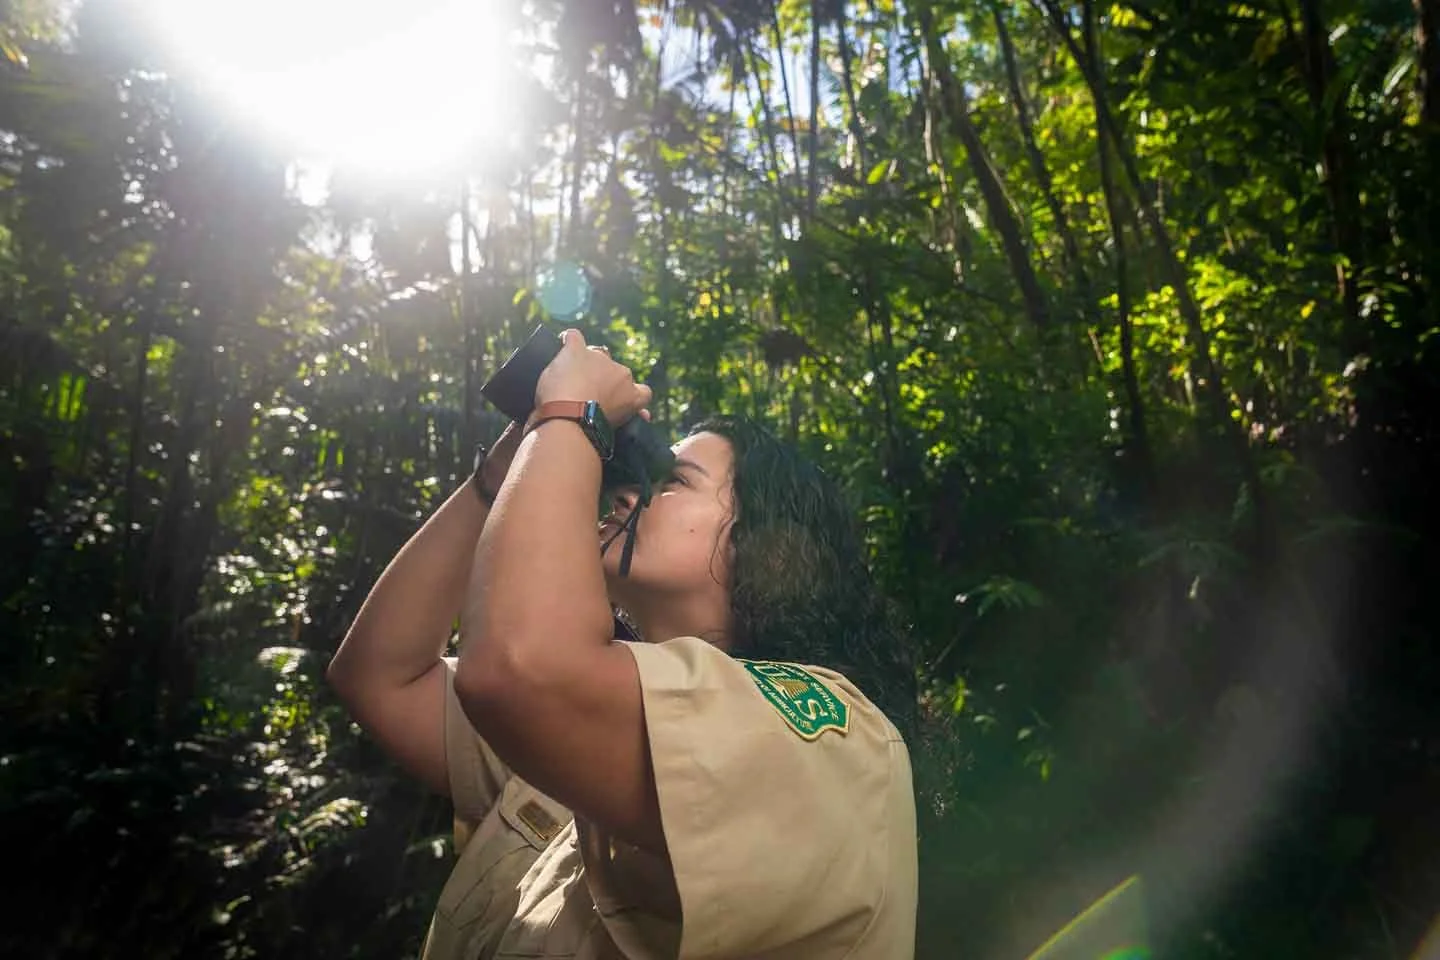
Examples of Long-Term Observations
PHOTO CREDITS Dave Moss air sampling: The Keeling Family, Christmas bird count watchers: Port Isabel Press South Padre, Marine sampling with CTD: Eric Vance, EPA, Terrestrial bird watching: USDA Forest Service/photo by Preston Keres, Atmospheric sampling balloon: NOAA/GML, Systems observations heat map: NASA's Jet Propulsion Laboratory


